
Build · Internal
Heuristics Evaluator
A screenshot in, a structured heuristic critique out.
Challenge
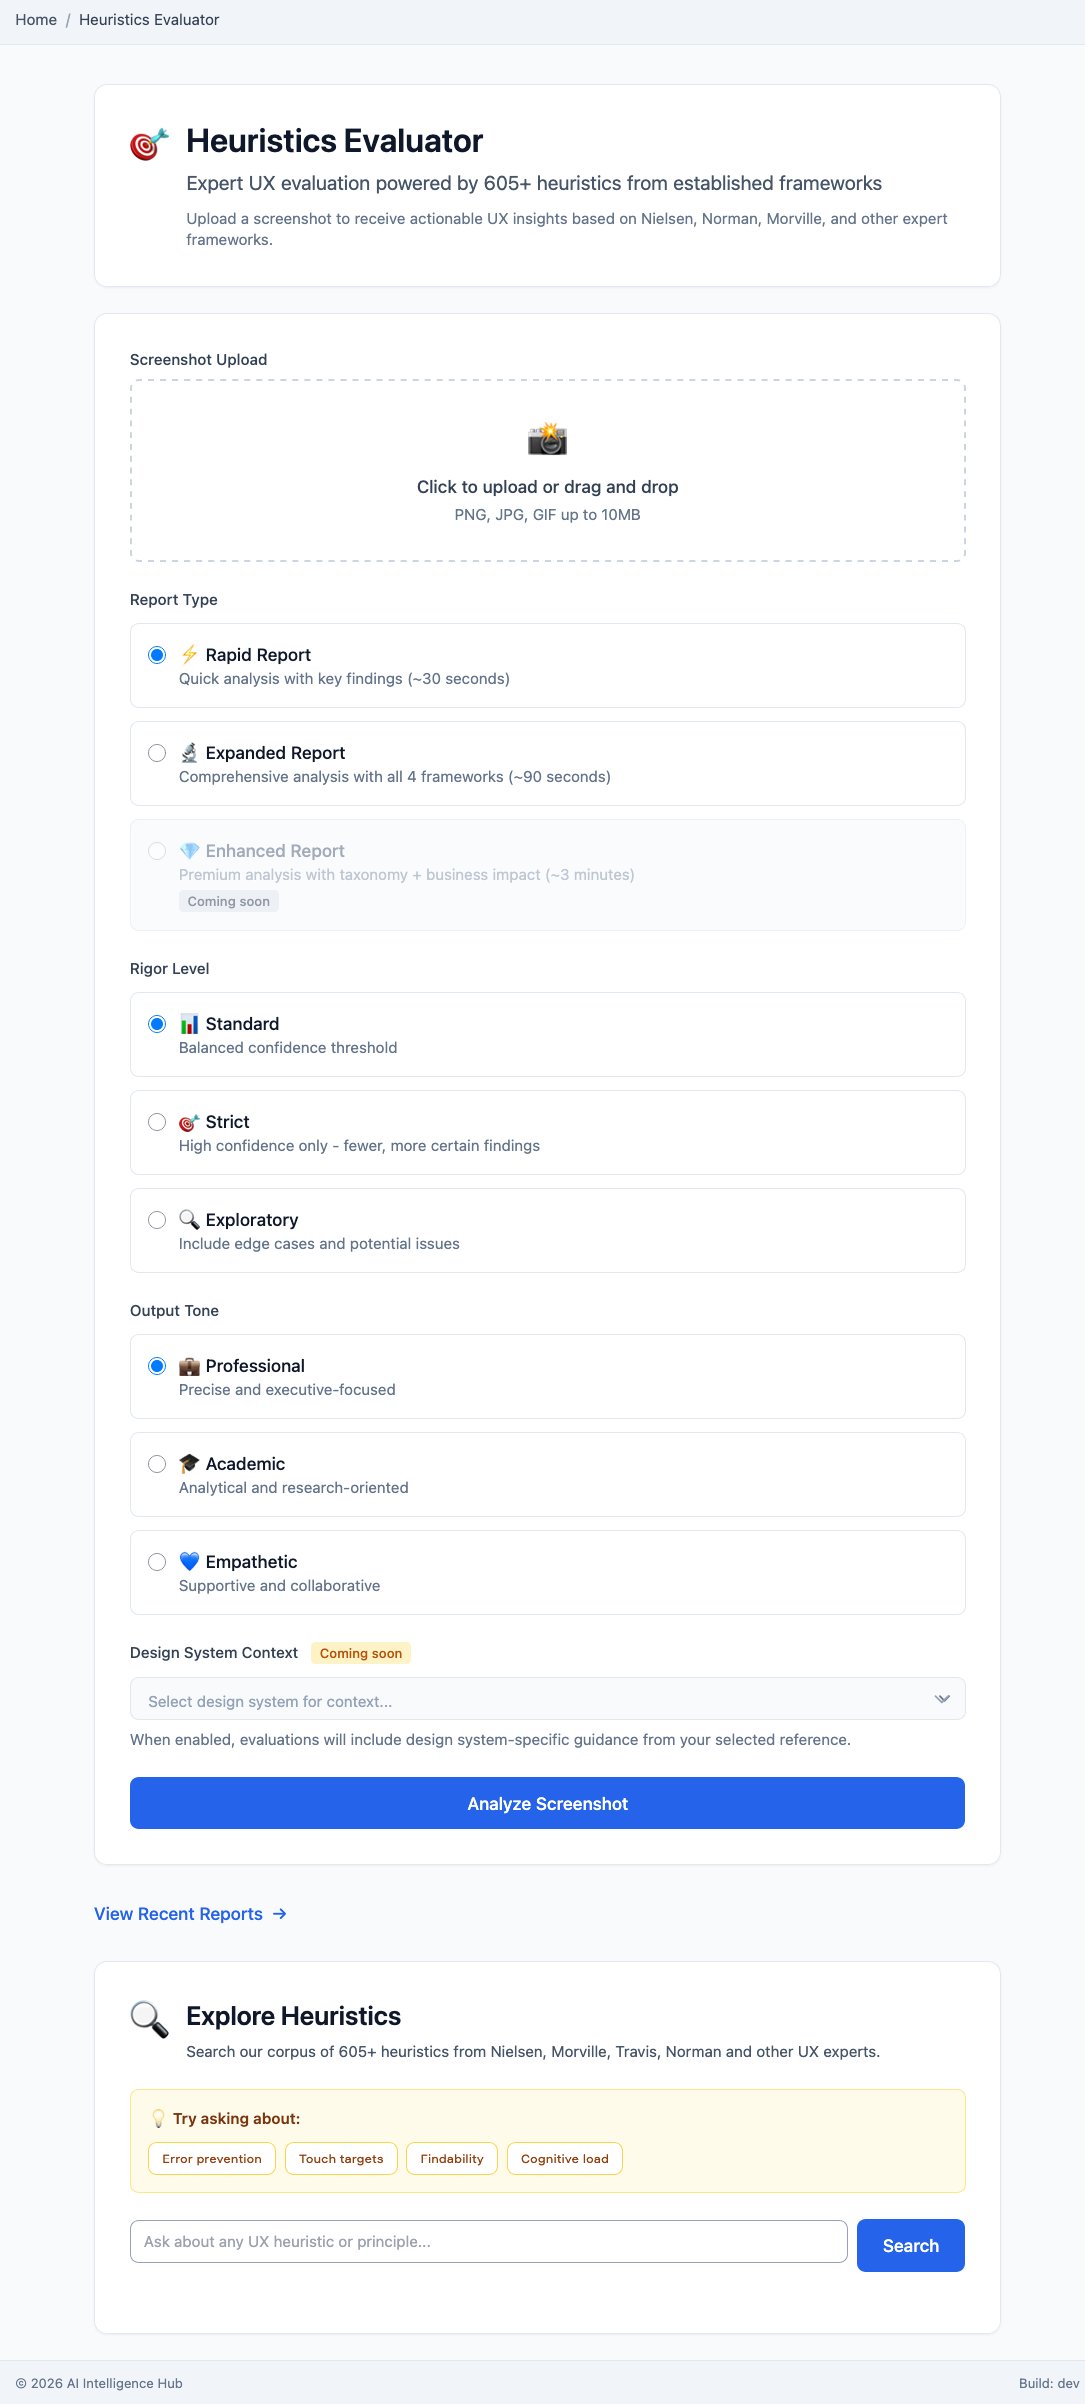
The Heuristics Evaluator is one of the first applications I built, and building it is what got me out of thinking only in RAGs. I had set out to make a Heuristics RAG, a queryable knowledge base of expert UX principles, and it is still running today. Partway through, I noticed that almost everything I was adding was prompt customization aimed at one specific job: evaluating a design. The work wanted to be an application sitting on top of the knowledge, and that realization is where the broader systems thinking behind the whole platform started.
The job itself is one I have done by hand for years: look at an interface and weigh it against established heuristics. It takes expertise, it takes time, and every screen you wish you could check is usually one you skip. I wanted a fast, credible read on a design in seconds, cheap to run, and on my own hardware.
Build

You hand it a screenshot, choose a report depth, a rigor level, and a tone, and it evaluates the design against more than 605 heuristics drawn from Nielsen, Morville, Travis, and Revang. The Rapid report is the one I reach for most: a high-level read in under thirty seconds that surfaces the key gotchas in a design, graded, cheap to run, and grounded in the corpus. It is the gut-check I used to run in my head, available on demand.
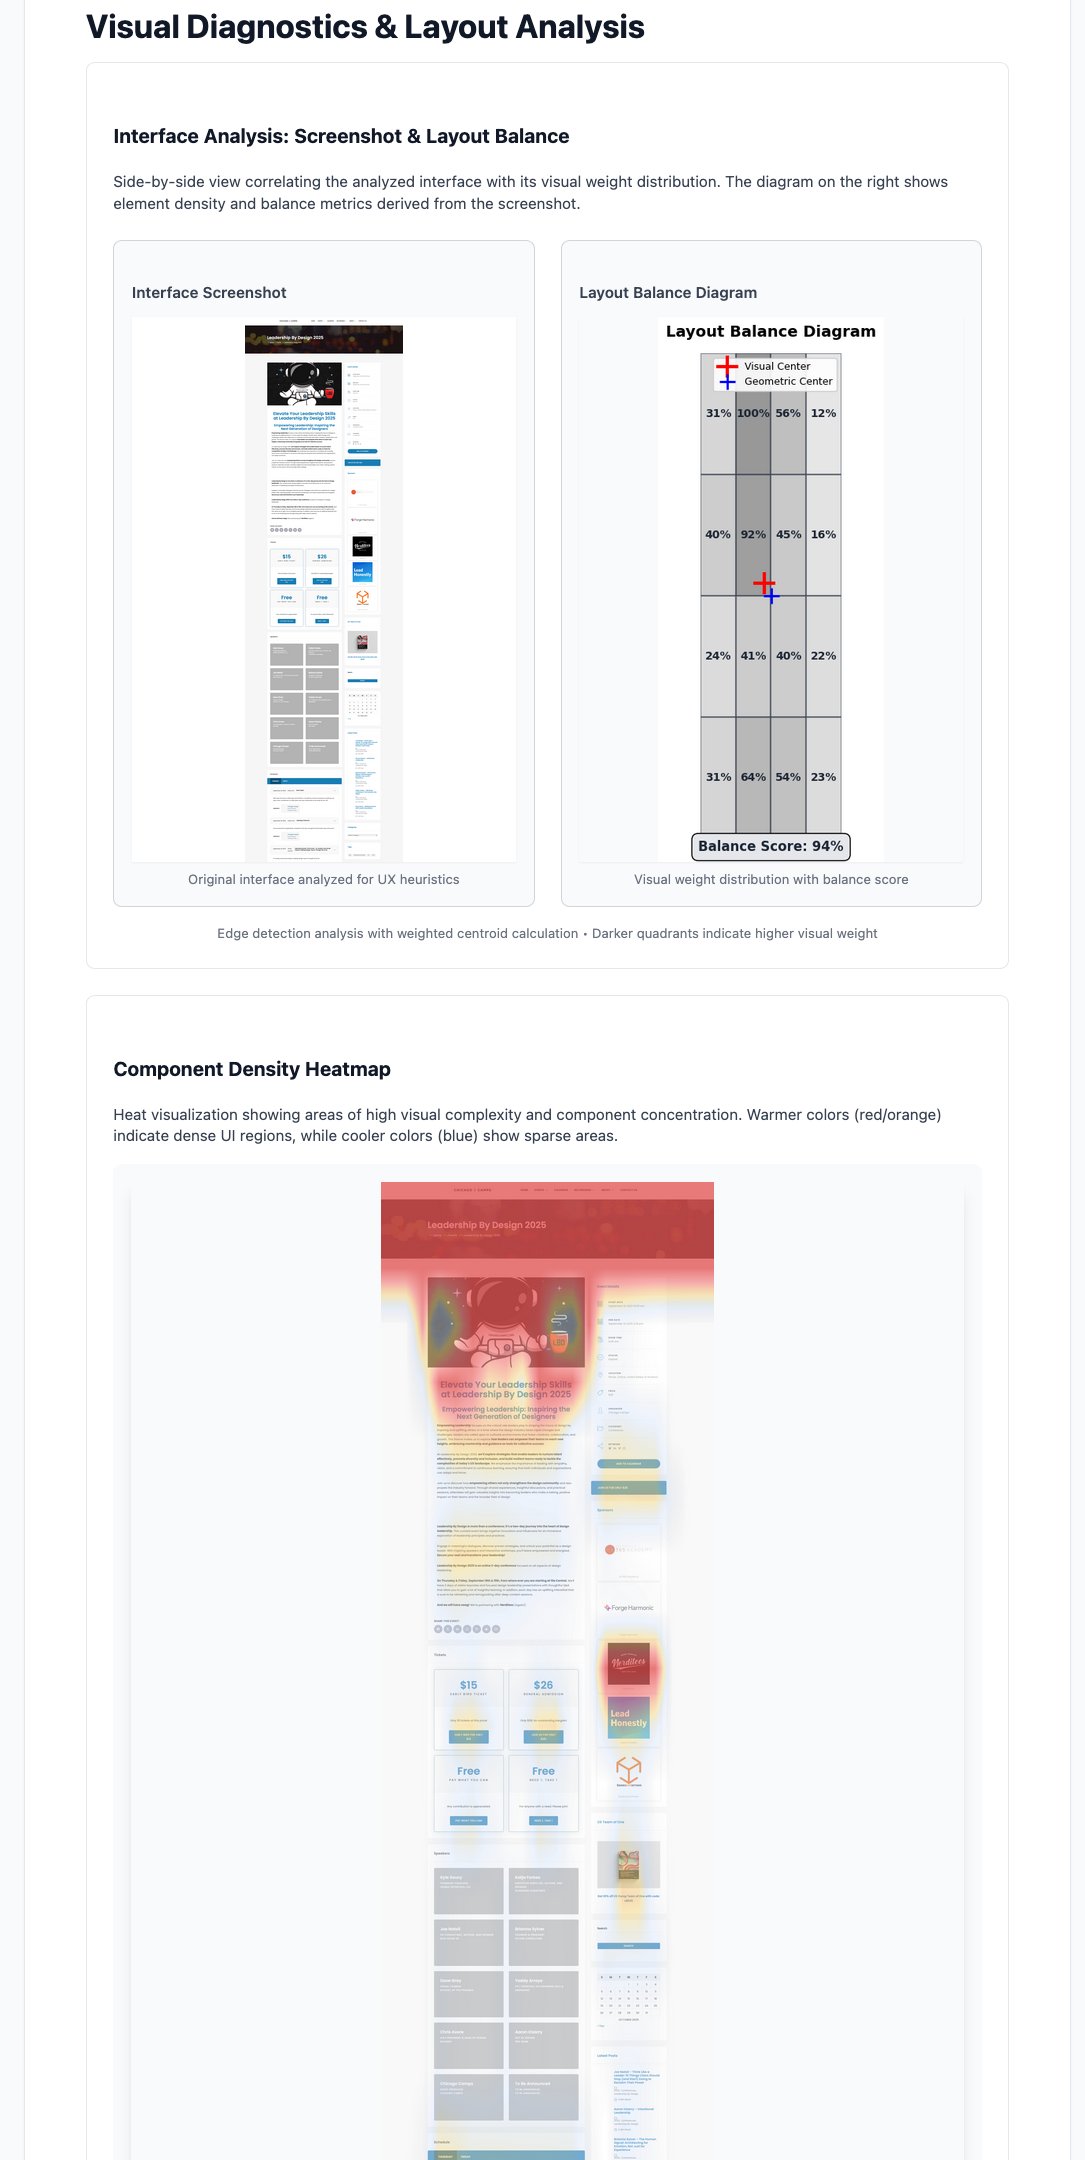
The Expanded report goes deeper, working through the heuristics section by section, scoring the design against each framework, and running real visual diagnostics on the screenshot itself: an edge-detection map of where visual weight lands, a layout-balance reading, and a density heatmap of where the interface gets crowded. Where the Rapid report flags that something is off, the Expanded report names the heuristic, the region it shows up in, and how much it matters.
Outcome
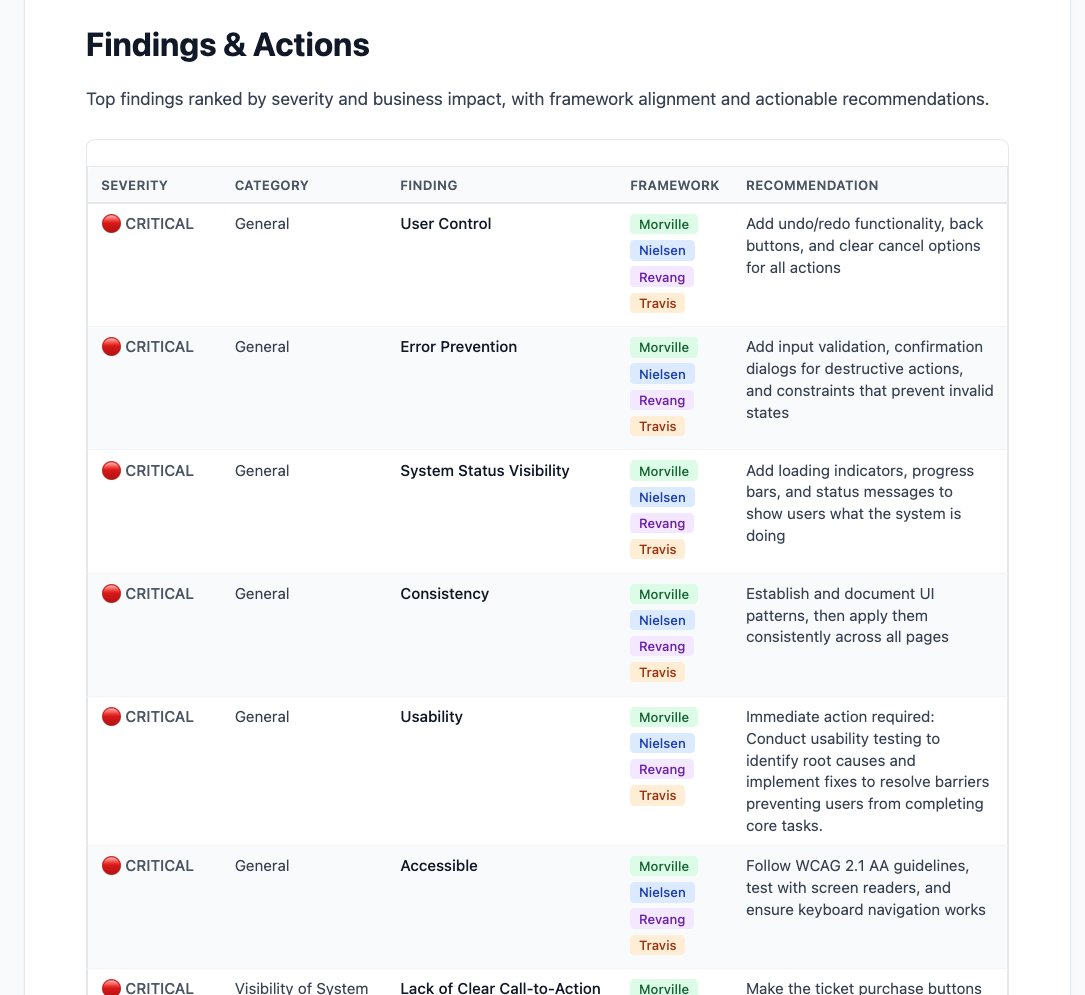
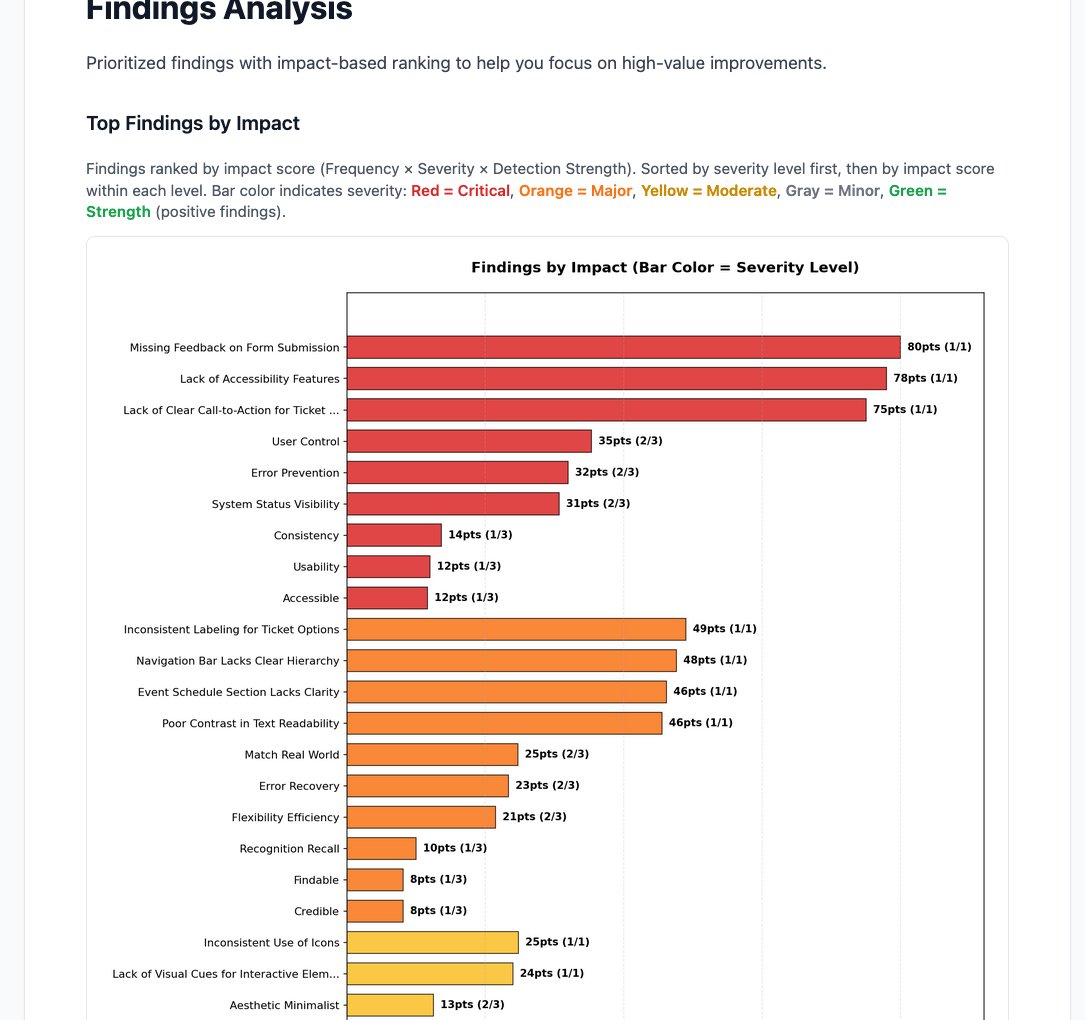
The system delivers a report you can hand to a team. Every finding is ranked by severity, attributed to its source framework, and paired with a specific recommendation. An impact score combines severity, frequency, and detection strength, so the findings sort by remediation priority. Because the evaluation sits on the heuristics corpus, the report documents its basis: the considerations it checked, those violated most often, and the share of the corpus it covered.
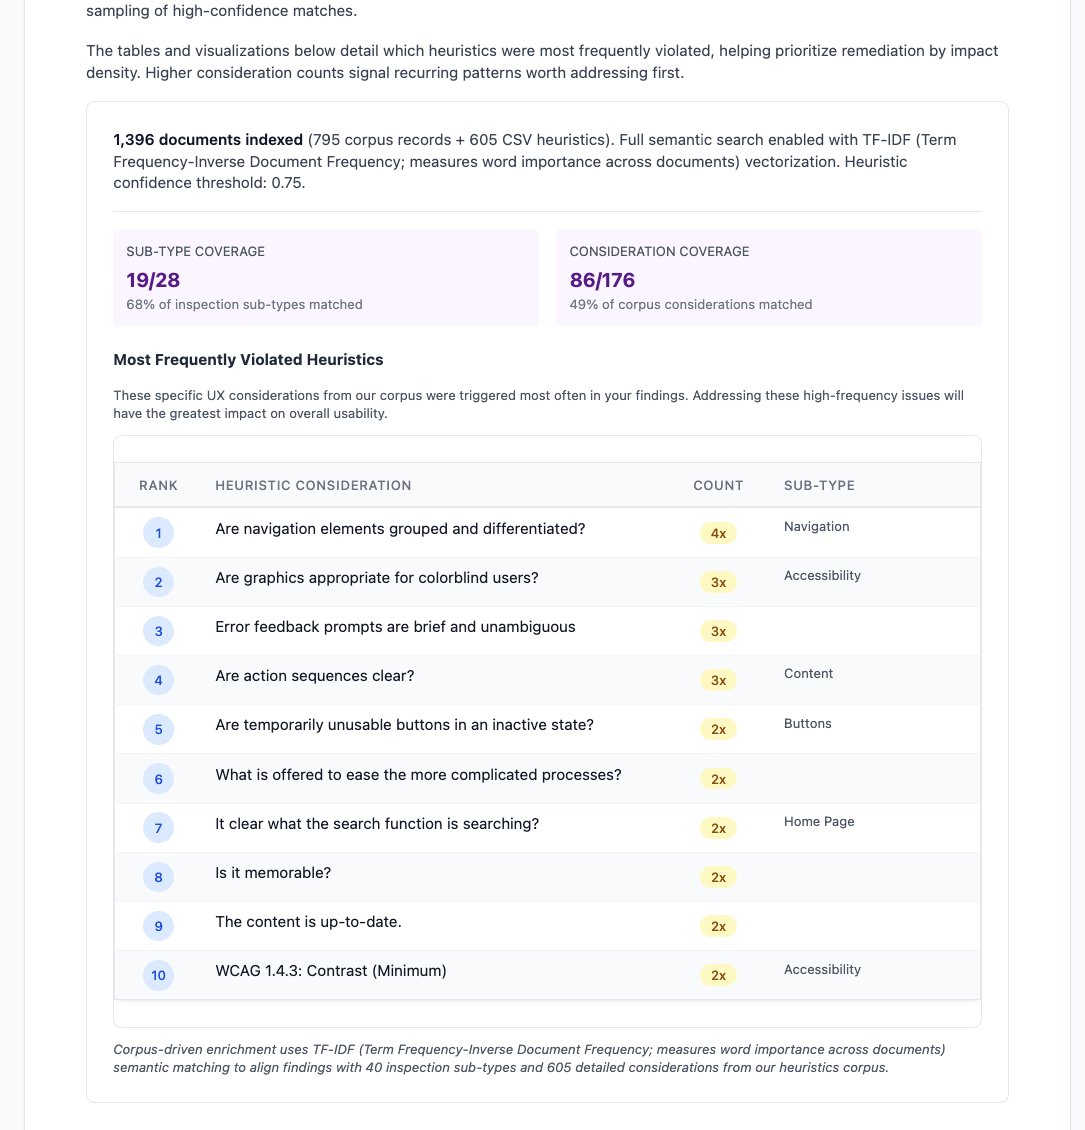
The scoring mechanism is built to be defensible. Each of the four frameworks begins at a 95 percent baseline, an honest acknowledgment that automated analysis observes less than a human reviewer would. Each finding then adjusts the score by its severity, the model's confidence in it, and how consistently it appears when the same screen is analyzed across multiple passes: an issue surfaced on every pass carries full weight, while one that appears once carries less. Positive findings add to the score as problems subtract from it. The four framework scores resolve into a single grade on a weighting I set deliberately: Nielsen usability at 35 percent, Morville's information architecture at 25, Revang and Travis at 20 each. A rigor setting of Standard, Strict, or Exploratory governs how heavily borderline findings count.
From a thirty-second gut-check to a sectioned audit, it is the heuristic review I have always done by hand, now on tap.
The Stack
Same pattern as the rest of the platform: Claude as pair-programmer for the build, local inference doing the evaluation, grounded in a heuristics corpus I assembled and run. The designs I analyze stay on hardware I own.
- More than 605 heuristics drawn from Nielsen, Morville, Travis, and Revang, alongside a wider UX-intelligence corpus
- A Rapid report for a thirty-second, low-cost read, and an Expanded report for a section-by-section audit
- Findings ranked by severity, tagged to framework, and sorted by an impact score of severity, frequency, and detection strength
- A grade weighted across the four frameworks (Nielsen 35%, Morville 25%, Revang 20%, Travis 20%) from a 95% baseline, with each finding weighted by severity, confidence, and how consistently it recurs across passes
- Visual diagnostics from the screenshot: an edge-detection weight map, layout balance, and a density heatmap
- Corpus-grounded results that show coverage and the most frequently violated heuristics
- Local inference on a dual-GPU Linux server, with a Mac Mini M4 for development
- Built around screenshot input, with live-URL evaluation as the next step